
Product Price Prediction
by John Wright, OPC Consultant Petroleum Economist
The oil industry is influenced by product prices yet is fairly poor at predicting them!
“2018 was another rollercoaster year for oil markets, with prices starting the year on a steady upward trend, reaching the dizzying heights of $85/bbl in October, before plunging in the final quarter to end the year at close to $50/bbl.”
Like the wider oil industry community, OPC is effected by product prices and thought a three monthly commentary of key data and how future prices may react would be a useful tool for OPC subscribers and an interesting interactive challenge of price prediction by the community.
The editorial will be formed of three parts:
- An annual database of historic and future prices
- Brent oil
- UK Gas
- Key metrics underlying price forecasting
- World economy
- Global production & demand
- OPEC production
- US production
- Oil inventories
- $ – £ exchange rate
- Political barometer
- Global
- US
- Middle East
- China
- OPC Price Forecast
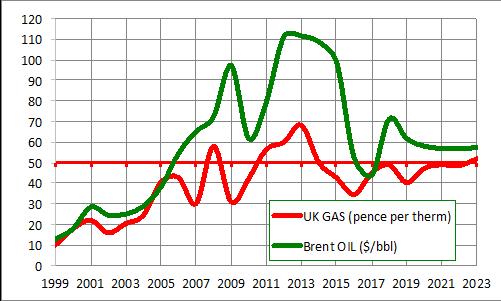
1a. Brent price has exhibited a roller coaster since its steady climb in 2003. Forward prices decline from current spot prices (backwardation)
1b. UK gas prices have tracked oil prices, if not as quite a thrilling ride! Forward prices rise from current spot price (contango)
Primary energy consumption increased by 2.9% in 2018. Growth was the strongest since 2010, and almost double the 10-year average of 1.5% per year (after BP Statistical Review)

World economy
After strong growth in 2017 and early 2018, global economic activity slowed notably in the second half of last year, reflecting a confluence of factors affecting major economies. China’s growth declined following a combination of needed regulatory tightening to rein in shadow banking and an increase in trade tensions with the United States. The euro area economy lost more momentum than expected as consumer and business confidence weakened and car production in Germany was disrupted by the introduction of new emission standards; investment dropped in Italy as sovereign spreads widened; and external demand, especially from emerging Asia, softened. Elsewhere, natural disasters hurt activity in Japan. Trade tensions increasingly took a toll on business confidence and, so, financial market sentiment worsened, with financial conditions tightening for vulnerable emerging markets in the spring of 2018 and then in advanced economies later in the year, weighing on global demand. Conditions have eased in 2019 as the US Federal Reserve signalled a more accommodative monetary policy stance and markets became more optimistic about a US–China trade deal, but they remain slightly more restrictive than in the fall.
Daily oil supply and demand
Oily supply and demand forecasts to be less out of kilter then they were in 2018; growing from 100 million barrels of oil equivalent in 2019 to slightly less than 104 million barrels of oil equivalent by the end of 2020.
A likely future energy scenario could include ”… growth continuing as India, China and Other Asia countries account for two-thirds of demand, with three quarters of growth from industry and buildings. Transport growth slows as gains in vehicle efficiency increase. The world continues to electrify with three-quarters of primary energy absorbed by the power sector. Demand for oil and other liquid fuels grow initially before gradually plateauing. Increases are initially dominated by US production but OPEC production subsequently increases as US tight oil declines. Natural gas grows robustly, supported by broad based demand and the increasing availability of gas, aided by the continuing expansion of LNG….”
OPEC production is forecast to fall from 37 million barrels per day in 2017/18 to 34.73 million barrels per day in 2020
US production reached a record of 11 million barrels per day in 2018. This is forecast to grow by a slower rate to reach 13.3 million barrels per day by 2020
Commercial inventories have dropped to below 60 days supply in 2018, from their peak of 65 days in 2017/17 – future inventories are expected to remain at 60 days into the future; towards the lower end of the monthly range (after EIA IS Energy information Administration)
Historically exchange rates on average allowed £1 pound to buy $1.60, yet since 2015 this has declined rapidly to the present rate of $1.27!
Political barometer
A Political barometer and its possible qualitative impact on oil price:
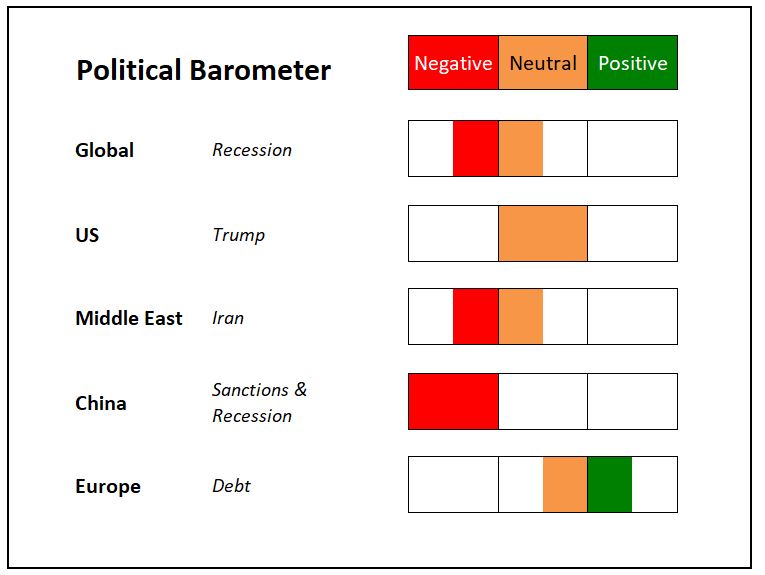
The political barometer indicated more negatives than positives but is fairly benign, which confirms the current slight backward dated market.
OPC Oil Price Forecast
The world economy is slightly less bearish than was projected late 2018 and middle east tensions, as always are abound, yet oil prices are still predicted to decline in the near future, though only marginally. On balance OPC predict prices to stay fairly constant, around $60, for the next year, but with some fairly major fluctuations – as have been seen in 2017/18.
Constant prices, around $60, with fluctuations
John Wright is the senior consultant Petroleum Economist for OPC. He has more than 25 years’ experience in oil and gas, initially within petroleum engineering and then specialising as an Economist within CNR, Amerada Hess and BG Group. He has worked as an expert petroleum economics consultant for more than 10 years, supporting a wide range of E&P companies and investors with economic modelling, portfolio valuation, fiscal agreement negotiation and decision analysis.
Call: +44 20 7428 1111
Email: london@opc.co.uk

Agree or disagree? Comment on OPC LinkedIn